Personal project trading analysis tool
Interactive P&L Calendar
A local trading journal that turns order history into daily realized P&L and a calendar you can explore.
- Python
- JavaScript
- HTML/CSS
- Webull API
The problem
My order history was hard to review by day. I wanted to see realized results on a calendar and open a date to inspect the trades behind it.
What I built
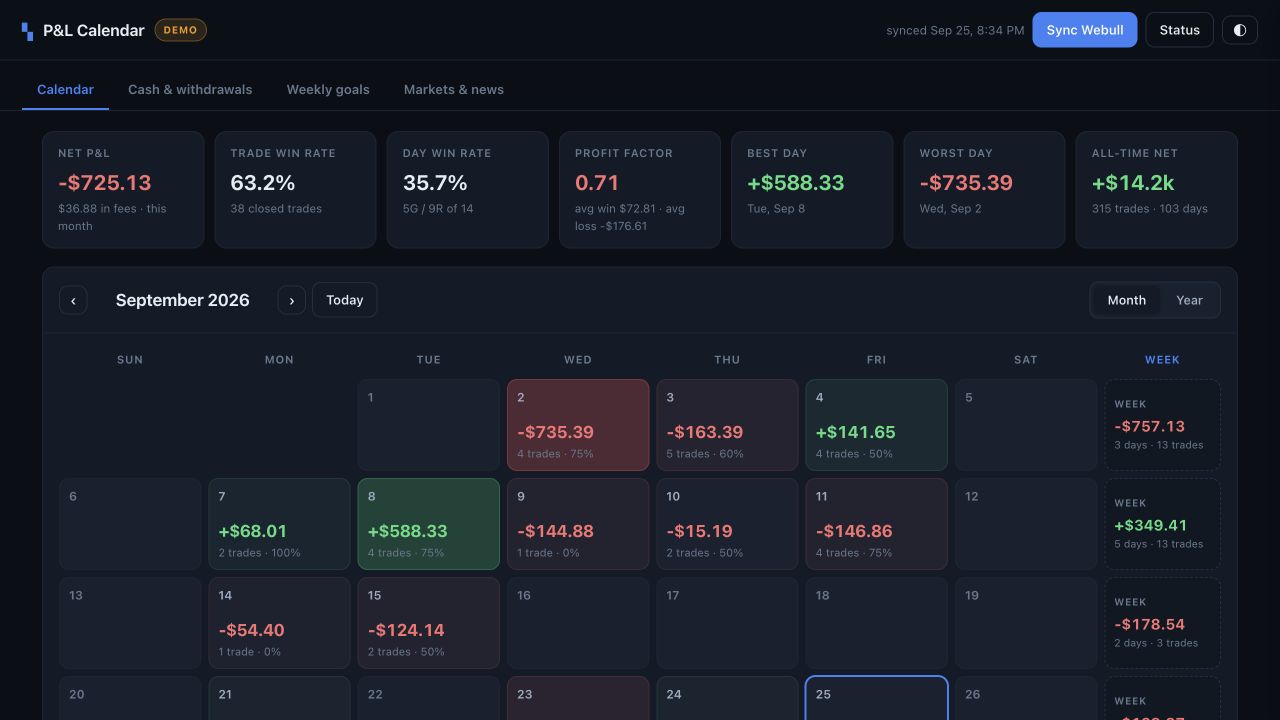
I built a local app that imports order history, calculates daily realized P&L, and displays it in month and year views. Clicking a day shows its closed trades. Demo mode uses generated sample data.
My contribution
Sole developer — API integration, the analysis layer, and the interactive front end.
How it works
The app imports Webull order history when configured, or starts with generated sample trades in demo mode.
A FIFO matcher pairs opening and closing fills, accounts for fees, and books realized P&L on the closing date.
The month and year views expose daily results; selecting a day opens its closed trades and details.
Technical decisions
Calculate before filtering
The matcher uses the full cached history, so a position opened in one month and closed in another appears on the correct closing day.
Keep the journal local
The server runs on the user's machine. The UI has a demo mode, and order history is cached locally when connected.