Personal project market analysis tool
Market Leadership Widget
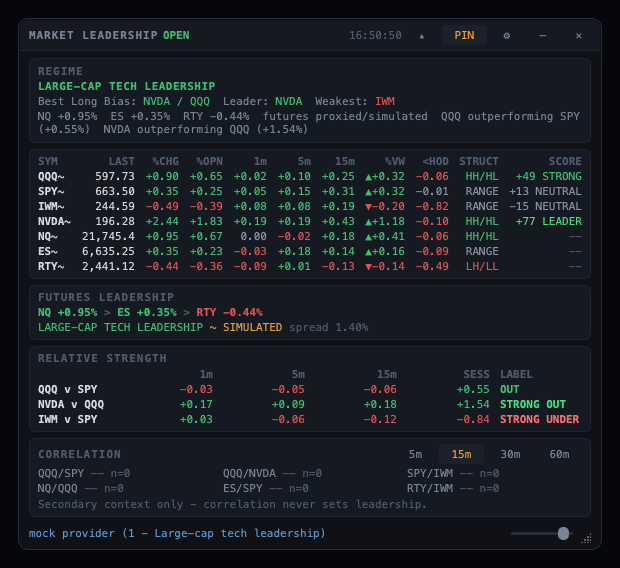
A macOS widget that compares market leadership across stocks, ETFs, and futures and explains each score.
- Python
- PySide6
- NumPy
- REST APIs
The problem
I wanted one place to compare which instruments were leading during a session. The data I was watching lived in separate views, and a score alone did not tell me what drove it.
What I built
I built a floating macOS dashboard that combines market feeds, ranks instruments, and shows the inputs behind each leadership score. It includes a simulated feed for testing without live data.
My contribution
Sole developer. I designed the scoring model, wrote the data layer, and built the interface — including the macOS-specific work to keep the widget floating above full-screen apps and across Spaces.
How it works
Market data providers supply quotes and intraday bars. The app can also run entirely on a built-in simulated feed.
A scoring engine normalizes seven inputs, including momentum, VWAP position, relative strength, market structure, and futures confirmation, then combines their weighted contributions.
The widget ranks instruments, labels the market regime, and lets the reader inspect the components behind a score.
Technical decisions
Explain the score
Each score keeps its component breakdown, so a user can see the evidence behind a leadership label.
Label incomplete feeds
When real futures data is unavailable, simulated futures are marked in the interface instead of being presented as live quotes.